Forex Trading Technical Analysis
November 03, 2025Mastering Forex Technical Analysis: A Complete Guide for Beginners
When trading Forex, there are two primary ways to analyze the market: Fundamental Analysis (studying economic news and data) and Technical Analysis.
Technical analysis is the study of historical price data and market statistics to predict future price movements. Technical traders believe that all current market information—economic data, trader psychology, and global events—is already reflected in the price on the chart. Therefore, by mastering the charts, you can identify high-probability trading opportunities.
Here is a full breakdown of the core technical analysis concepts every beginner must master.
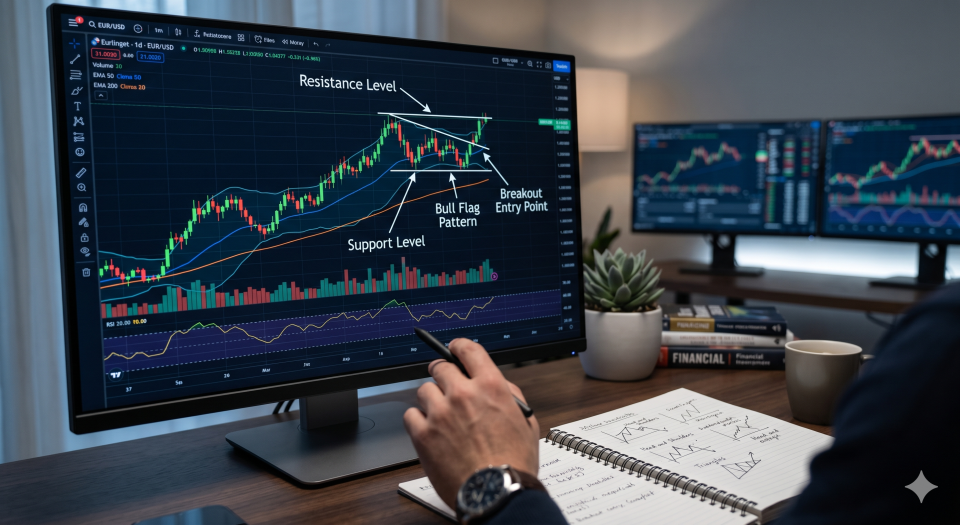
1. Support and Resistance Levels
Support and resistance are the foundational building blocks of technical analysis. They represent psychological price levels where the market has historically struggled to push past.
Support (The Floor): This is a price level below the current market price where buying interest is strong enough to overcome selling pressure. When the price drops to a support level, it often bounces back up. Think of it as a "floor" that prevents the price from falling further.
Resistance (The Ceiling): This is a price level above the current market price where selling pressure overcomes buying pressure. When the price rises to a resistance level, it often pulls back down. Think of it as a "ceiling" that caps upward movement.
The Role Reversal Rule: A critical concept to remember is that once a resistance level is decisively broken, it frequently turns into a new support level. Conversely, a broken support level often becomes a new resistance level.
2. Trend Identification
There is a famous saying in trading: "The trend is your friend." Trading in the direction of the overall market momentum is generally much safer than trying to predict reversals.
Uptrend: A market is in an uptrend when it is consistently making Higher Highs (HH) and Higher Lows (HL). This indicates that buyers are in control. In an uptrend, traders look for opportunities to buy (go long) during temporary pullbacks (dips).
Downtrend: A market is in a downtrend when it is making Lower Highs (LH) and Lower Lows (LL). This shows that sellers are dominating the market. In a downtrend, traders look for opportunities to sell (go short) during temporary rallies.
Ranging Market (Consolidation): The market doesn't always move up or down. Often, it moves sideways between established support and resistance levels. In a ranging market, traders typically buy at support and sell at resistance until a breakout occurs.
3. Japanese Candlesticks
Instead of simple line charts, most Forex traders use Japanese candlestick charts because they provide significantly more information about price action within a specific time period.
Anatomy of a Candlestick: Each candle represents a specific timeframe (e.g., 1 hour, 1 day) and shows four key data points: the Open, High, Low, and Close (OHLC). The thick part is the "body" (the difference between the open and close), and the thin lines on top and bottom are the "wicks" or "shadows" (the highest and lowest prices reached).
Bullish vs. Bearish Candles: A bullish candle (often colored green or white) means the closing price was higher than the opening price. A bearish candle (often colored red or black) means the closing price was lower than the opening price.
Candlestick Patterns: Traders look for specific shapes that indicate market psychology. For example, a Doji (a candle with almost no body and long wicks) indicates market indecision. A Bullish Engulfing Pattern (a large green candle that completely overshadows the previous small red candle) signals a strong shift in momentum toward the buyers.
4. Key Chart Patterns
As price moves over time, it forms geometric shapes and patterns on the chart. These patterns act as visual representations of the ongoing battle between buyers and sellers and can hint at what happens next.
Reversal Patterns: These patterns signal that the current trend is ending and the market is about to reverse direction.
Head and Shoulders: Indicates a shift from an uptrend to a downtrend.
Double Top / Double Bottom: A Double Top looks like an "M" and signals a bearish reversal. A Double Bottom looks like a "W" and signals a bullish reversal.
Continuation Patterns: These patterns suggest that the market is just taking a brief pause (consolidating) before continuing in the direction of the main trend.
Flags and Pennants: Small periods of consolidation that look like a flag on a pole, usually followed by a sharp breakout in the direction of the original trend.
Triangles (Ascending, Descending, and Symmetrical): Price squeezes into a tighter and tighter range before eventually bursting out with strong momentum
6. Fibonacci Retracement Levels
Markets rarely move in a straight line. Even in a strong uptrend, the price will pull back (or retrace) before continuing its upward journey. Fibonacci retracement levels help traders predict where that pullback is likely to end.
The Golden Ratio: Based on a famous mathematical sequence, the most important Fibonacci levels in Forex are 38.2%, 50.0%, and 61.8%.
How to Use It: If a currency pair makes a massive move upwards, a trader will draw the Fibonacci tool from the bottom of the move to the top. The lines that appear at the 38.2%, 50%, and 61.8% levels act as hidden support areas. Traders often wait for the price to drop to one of these levels to buy in at a "discount" before the trend resumes.
The 61.8% Pocket: The 61.8% level is highly watched by institutional traders. A bounce from this level is often considered a very strong continuation signal.
7. Multiple Timeframe Analysis (MTFA)
Looking at just one chart timeframe can give you a distorted view of the market. Multiple Timeframe Analysis is the practice of zooming out to see the "big picture" before zooming in to execute a trade.
The Top-Down Approach: Professional traders always start with a higher timeframe (like the Daily or 4-Hour chart) to determine the overall, dominant trend.
Finding the Entry: Once the major trend is identified, traders zoom in to a lower timeframe (like the 1-Hour or 15-Minute chart) to find precise entry points, support/resistance levels, and candlestick patterns.
Avoiding Traps: If the 15-Minute chart looks like a strong uptrend, but the Daily chart shows the price is hitting a massive historical resistance wall, MTFA saves you from placing a bad buy order. Always ensure your lower timeframe trade aligns with the higher timeframe trend.
8. Volatility Indicators
While moving averages tell you about trend direction, volatility indicators tell you about the market's speed, energy, and potential range.
Bollinger Bands: This indicator consists of three lines: a middle moving average, and an upper and lower band that expand and contract based on market volatility.
The Squeeze: When the bands pinch tightly together, it means the market is quiet and a massive breakout is likely coming soon.
Over-extension: When the price touches or pierces the outer bands, it is often considered over-extended and may snap back toward the middle line (mean reversion).
Average True Range (ATR): The ATR tells you exactly how many pips a currency pair moves, on average, over a set period. If the Daily ATR for EUR/USD is 80 pips, and it has already moved 75 pips today, you know the market is likely exhausted. The ATR is also the ultimate tool for calculating where to place your Stop-Loss so you don't get kicked out of a trade by normal, everyday price fluctuations.
9. Breakouts, Pullbacks, and Retests
Understanding market structure isn't just about drawing lines; it's about observing how the price reacts to those lines.
The Breakout: This happens when the price forcefully pushes through a strong support or resistance level with high momentum. Amateurs often "chase" breakouts, buying exactly when the price breaks, which is highly risky.
The Fakeout (False Breakout): Often, the price will peek above resistance, trap eager buyers, and immediately crash back down. This is where impatient traders lose their money.
The Retest (The Safe Entry): The most professional way to trade a breakout is to wait for the retest. When resistance breaks, wait for the price to slowly pull back down and "retest" that broken line. If the old resistance holds as new support, that is your high-probability entry signal.
10. The Power of "Confluence"
This is the secret sauce of profitable trading. Confluence means combining multiple, independent technical analysis tools to confirm a single trade idea. You should never take a trade based on just one signal.
Low Probability Trade: Buying simply because the RSI says the market is "oversold."
High Probability Trade (Confluence): You buy because the overall Daily trend is UP, the price has pulled back to a 61.8% Fibonacci level, that same level aligns with a major support zone, and the 1-Hour chart just printed a massive Bullish Engulfing candlestick.
The Takeaway: The more reasons you have to take a trade, the higher your win rate will be. Stacking these odds in your favor is what separates gamblers from professional traders.
Ready to Master the Charts?
Reading about technical analysis is one thing, but applying it to live, moving charts is a completely different challenge.
At Skillmining.Net, our Forex Trading Course doesn't just give you textbook definitions. We provide over-the-shoulder video modules where we analyze real charts together. You will learn how to properly draw Fibonacci levels, spot high-probability candlestick patterns, and build a customized trading plan based on ultimate confluence.
Stop guessing and start analyzing. Join the Skillmining.Net community today and transform the way you look at the markets!